Debugging the workbench
The debugger lets you pause the shared simulation, inspect why a program made a decision, and continue one instruction or one coordinated world tick at a time. The best way to learn it is with the shared Scenario Workbench.
Start with the mixed world
Open:
text
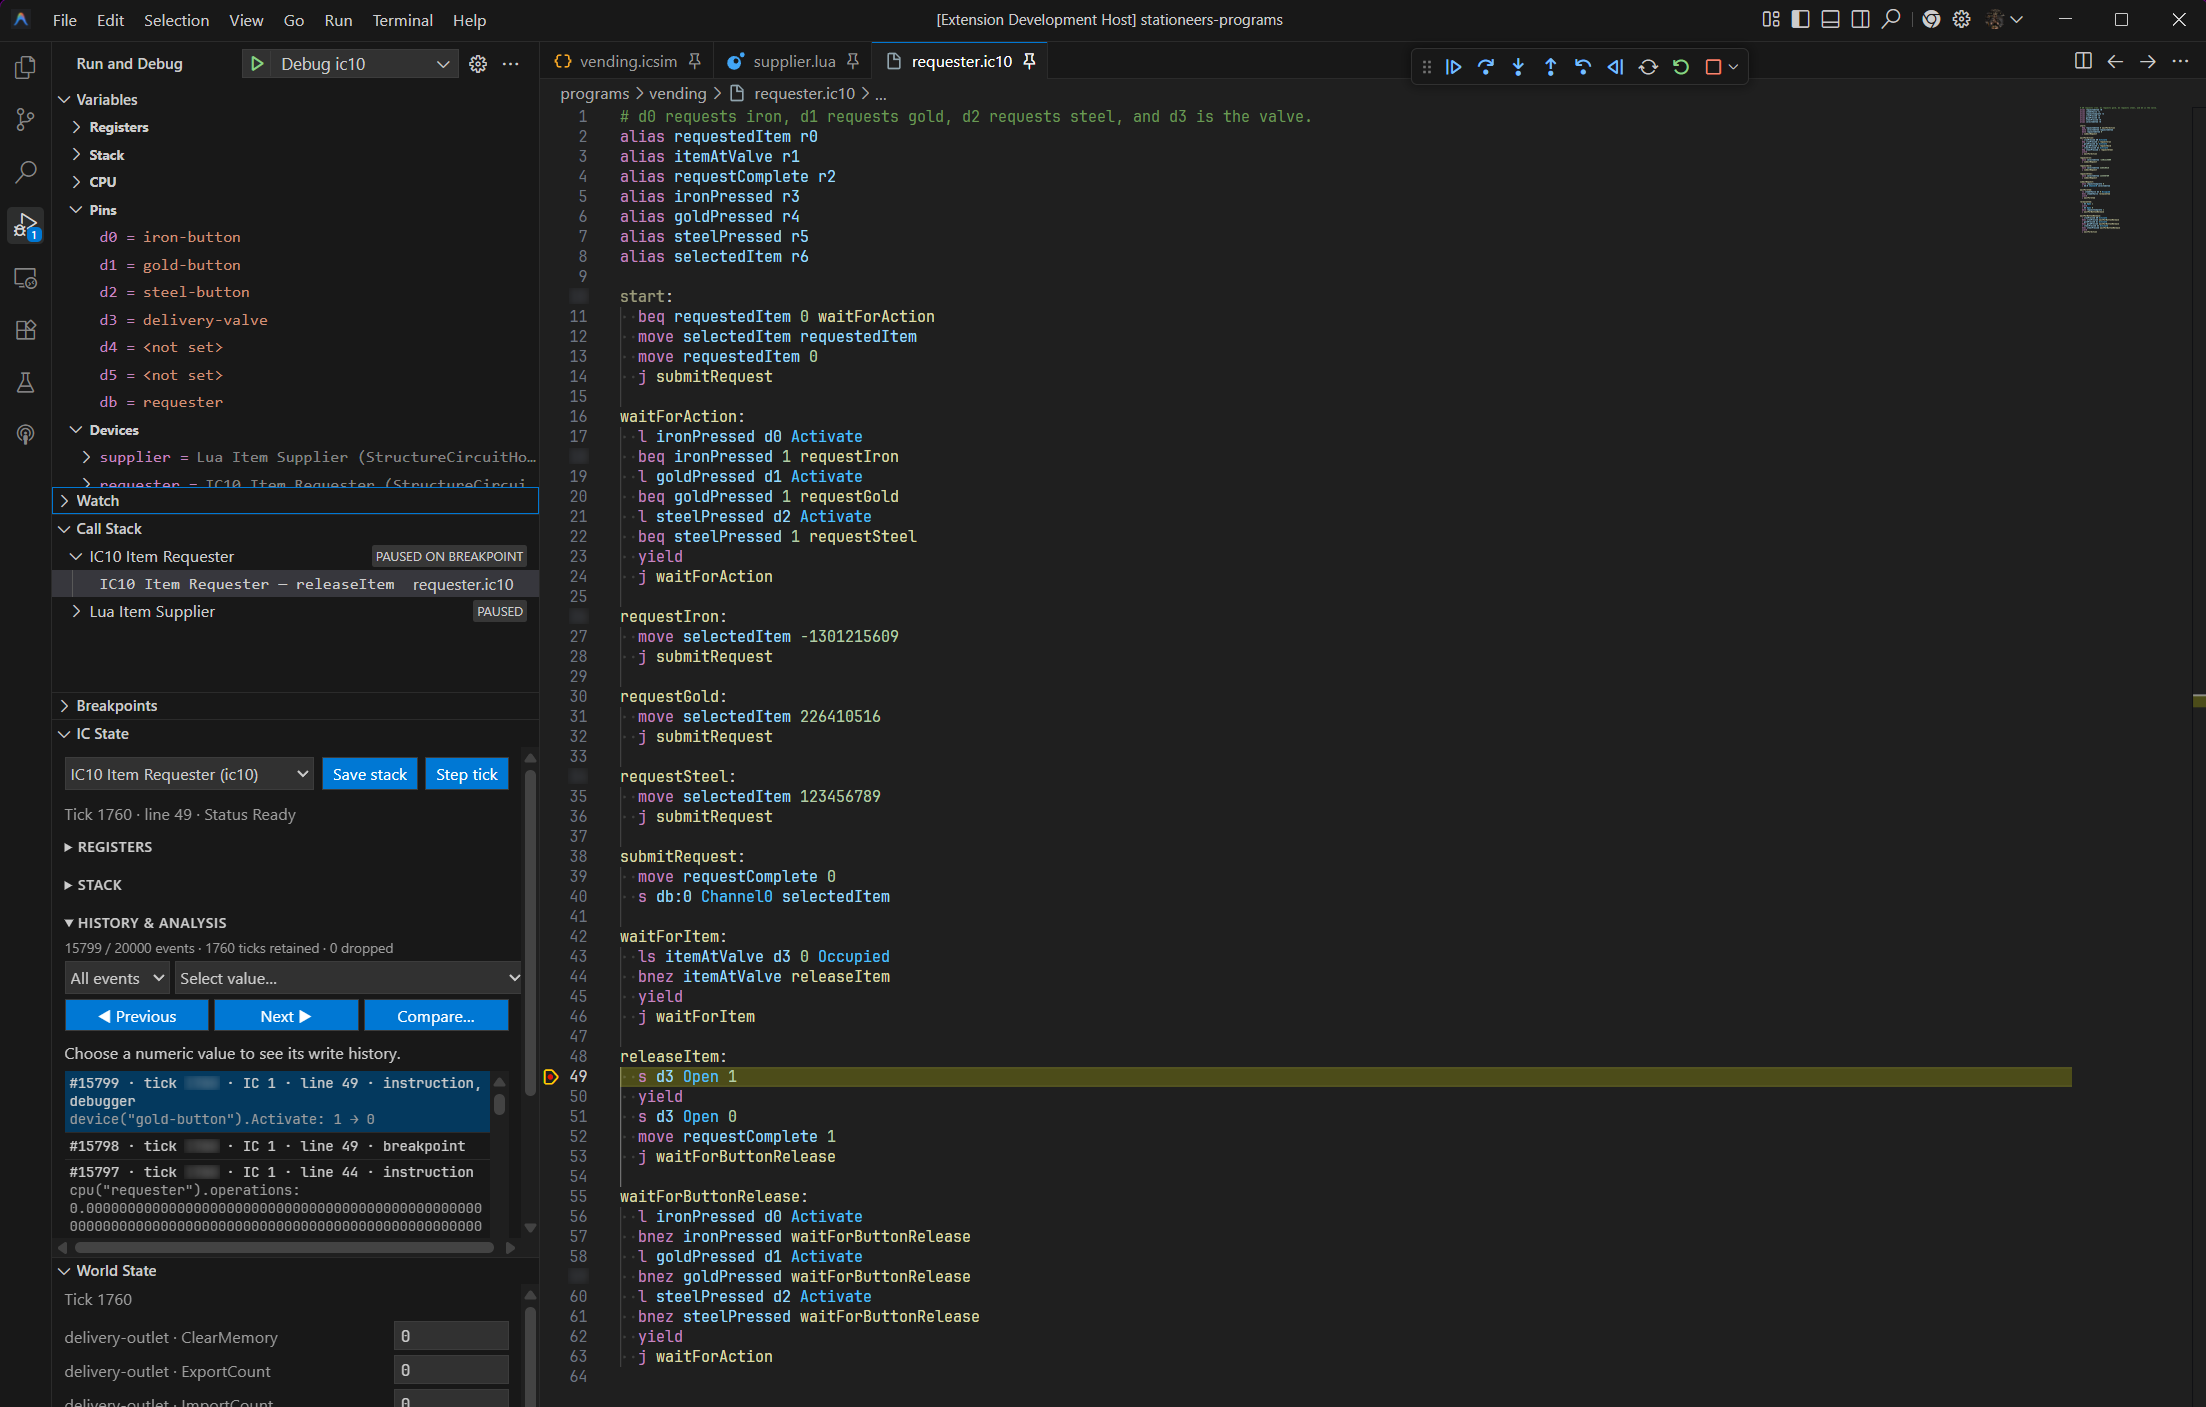
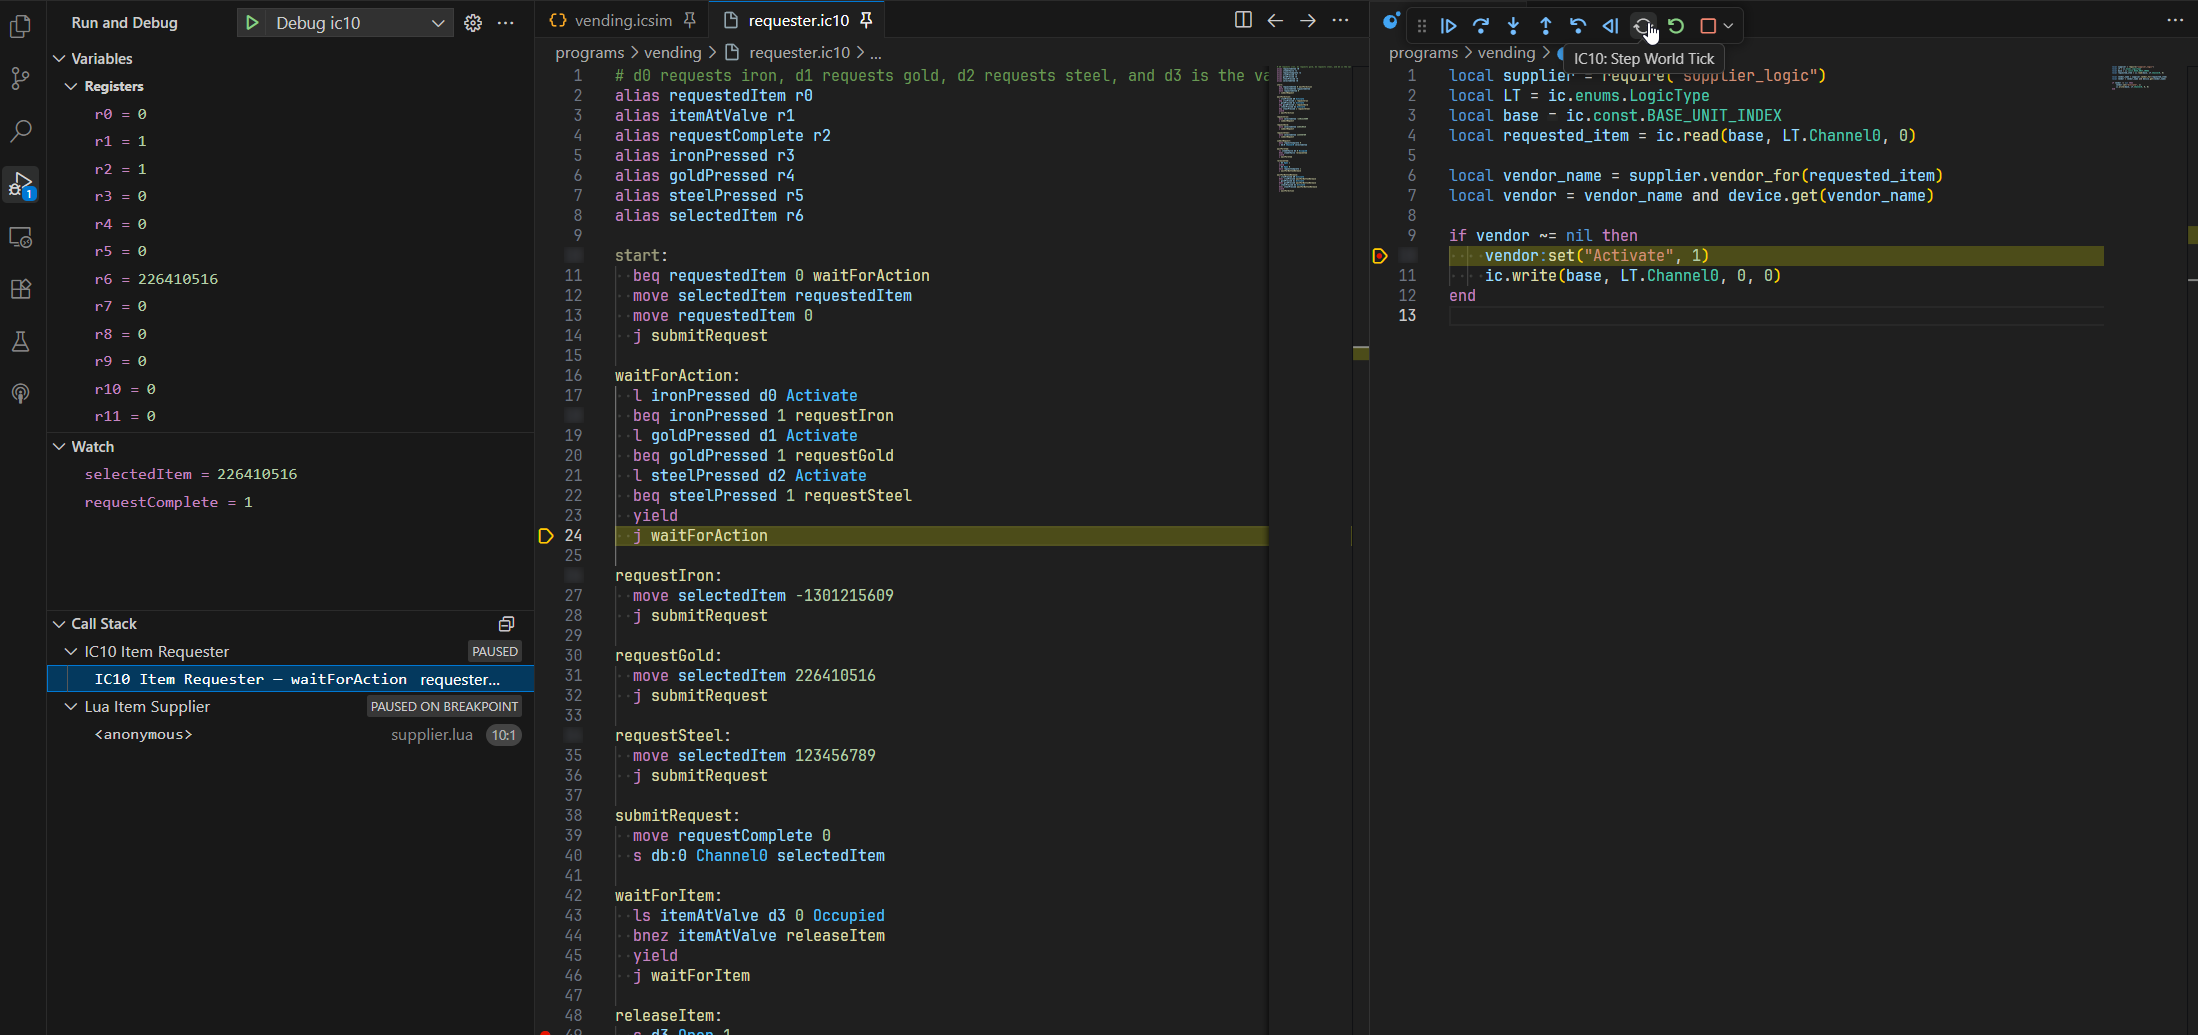
examples/scenario-workbench/testing/workbench.icsimSelect either the requester IC housing or the supplier Lua program and press F5. The debug session contains one thread per runnable program. IC10 and Lua threads appear together in the Call Stack, can be stepped independently, and share the same cable network, vending machines, chute path, and delivery outlet. Lua source breakpoints, call frames, and live local scopes are available alongside IC10 registers and device state. Use the iron or gold button in the simulation editor to start a real request; use the steel button to inspect the unavailable-item path.
A useful first breakpoint
Set a breakpoint on the releaseItem: label in examples/scenario-workbench/requester.ic10:
ic10
releaseItem:
  s d0 Open 1
  yield
  s d0 Open 0
move requestComplete 1When the delivery arrives, inspect:
r0— the requested item hash;r1— the value read from the delivery valve slot;r2— whether the request has completed;device("delivery-valve").Open— the shared-world valve state;- the delivery outlet slot — the item that arrived.
Step through the world
Use normal Step to execute one instruction or Lua source line on the selected runtime. Use IC10: Step World Tick to advance every eligible runtime together, which is usually the better way to understand the Lua supplier and IC10 requester interacting.
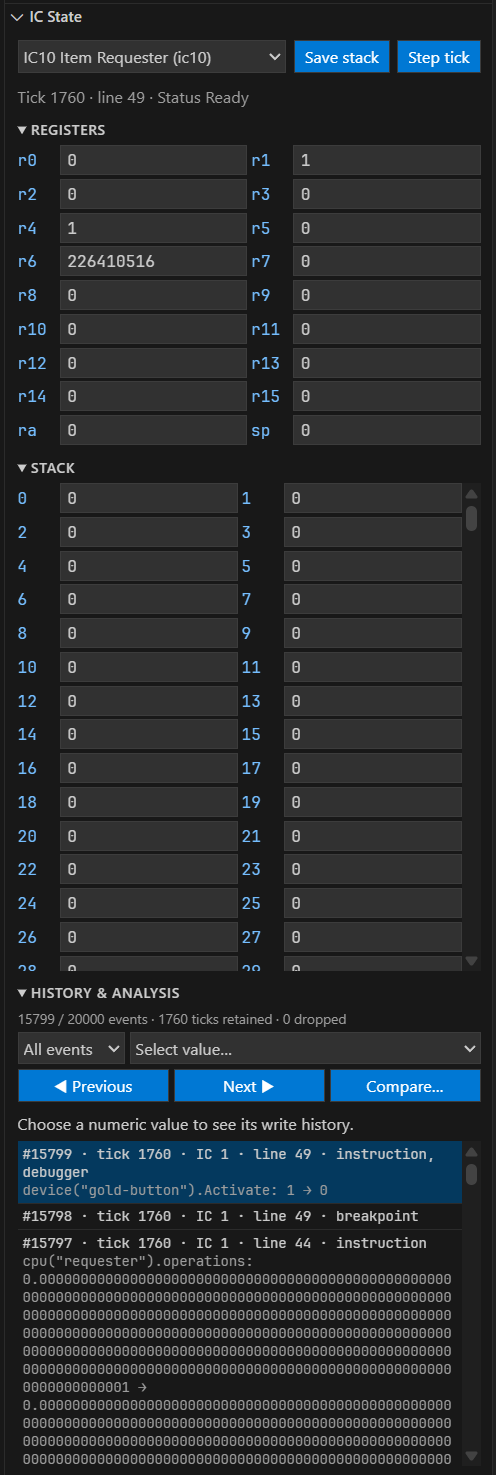
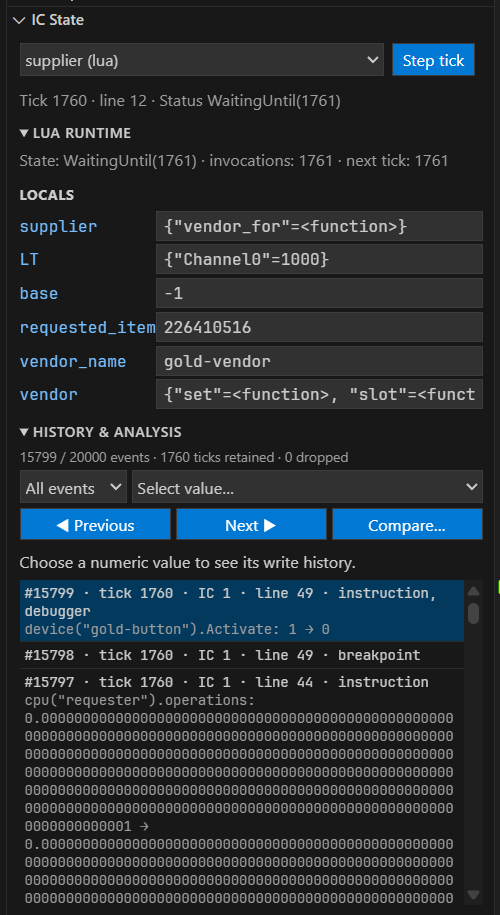
While paused, the Variables and Watch views can inspect registers, stack cells, device fields, slots, memory, and network channels. Conditions and logpoints use the same expressions as the scenario assertions.
Debug a failing test
Open the intentionally failing fixture:
text
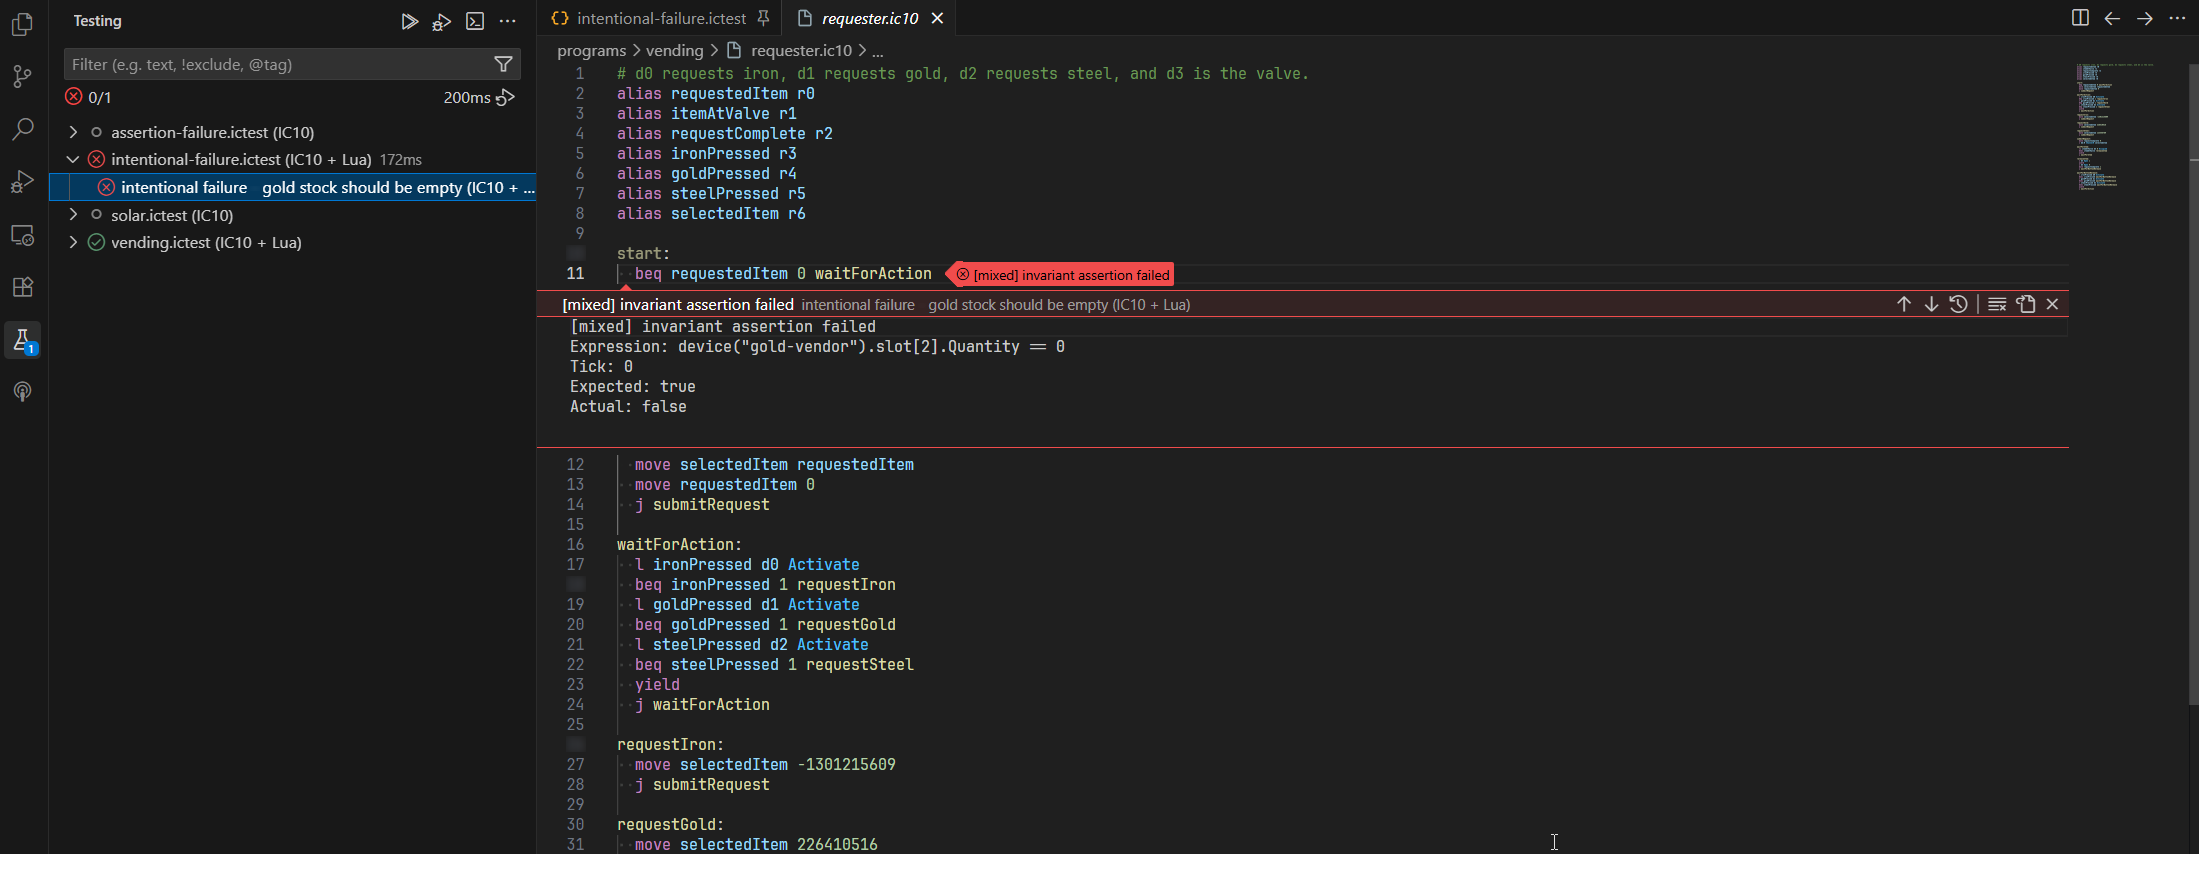
examples/scenario-workbench/testing/failures/intentional-failure.ictestIt incorrectly expects the gold vendor's stock to be zero. Run it from Test Explorer, open the failure, and launch the debugger from the case. This gives you a safe example of pausing on an assertion failure, inspecting the actual slot state, and deciding whether the program or the test expectation is wrong.
For the full simulator boundary and current behaviour coverage, see the simulator guide and compatibility report.